Key Takeaways:
Guyana’s 2024–2025 national mineral mapping is a structural upgrade, embedding capacity at GGMC and reducing exploration and allocation uncertainty.1
Because gold dominates non-oil exports, better geology and planned licensing translate into lower financing friction and greater macro resilience.2
Monitoring, Reporting, and Verification System (MRVS) evidence shows mining is the leading driver of deforestation; pre-competitive mapping narrows the search envelope and curbs speculative clearing.4
With the Mining Act, Environmental Protection Act, and EITI participation already in place, Guyana can connect data to transparent allocation, drawing on Brazil’s SOPLE and Ghana’s L.I. 2176 as models.8
Why now
In April 2024, the Ministry of Natural Resources issued an RFP for a “Mineral Mapping Study of Guyana’s Mineral Resources (Gold & Non-Traditional Minerals)” to identify and close data gaps, reduce investment frictions, and foster diversification.1 The scope runs from historical review and methodology to legal/policy, investment climate, and technical outputs, with GGMC staff embedded so capability endures post-contract completion.1
Mineral Mapping RFP (2024): Objectives & Requirements
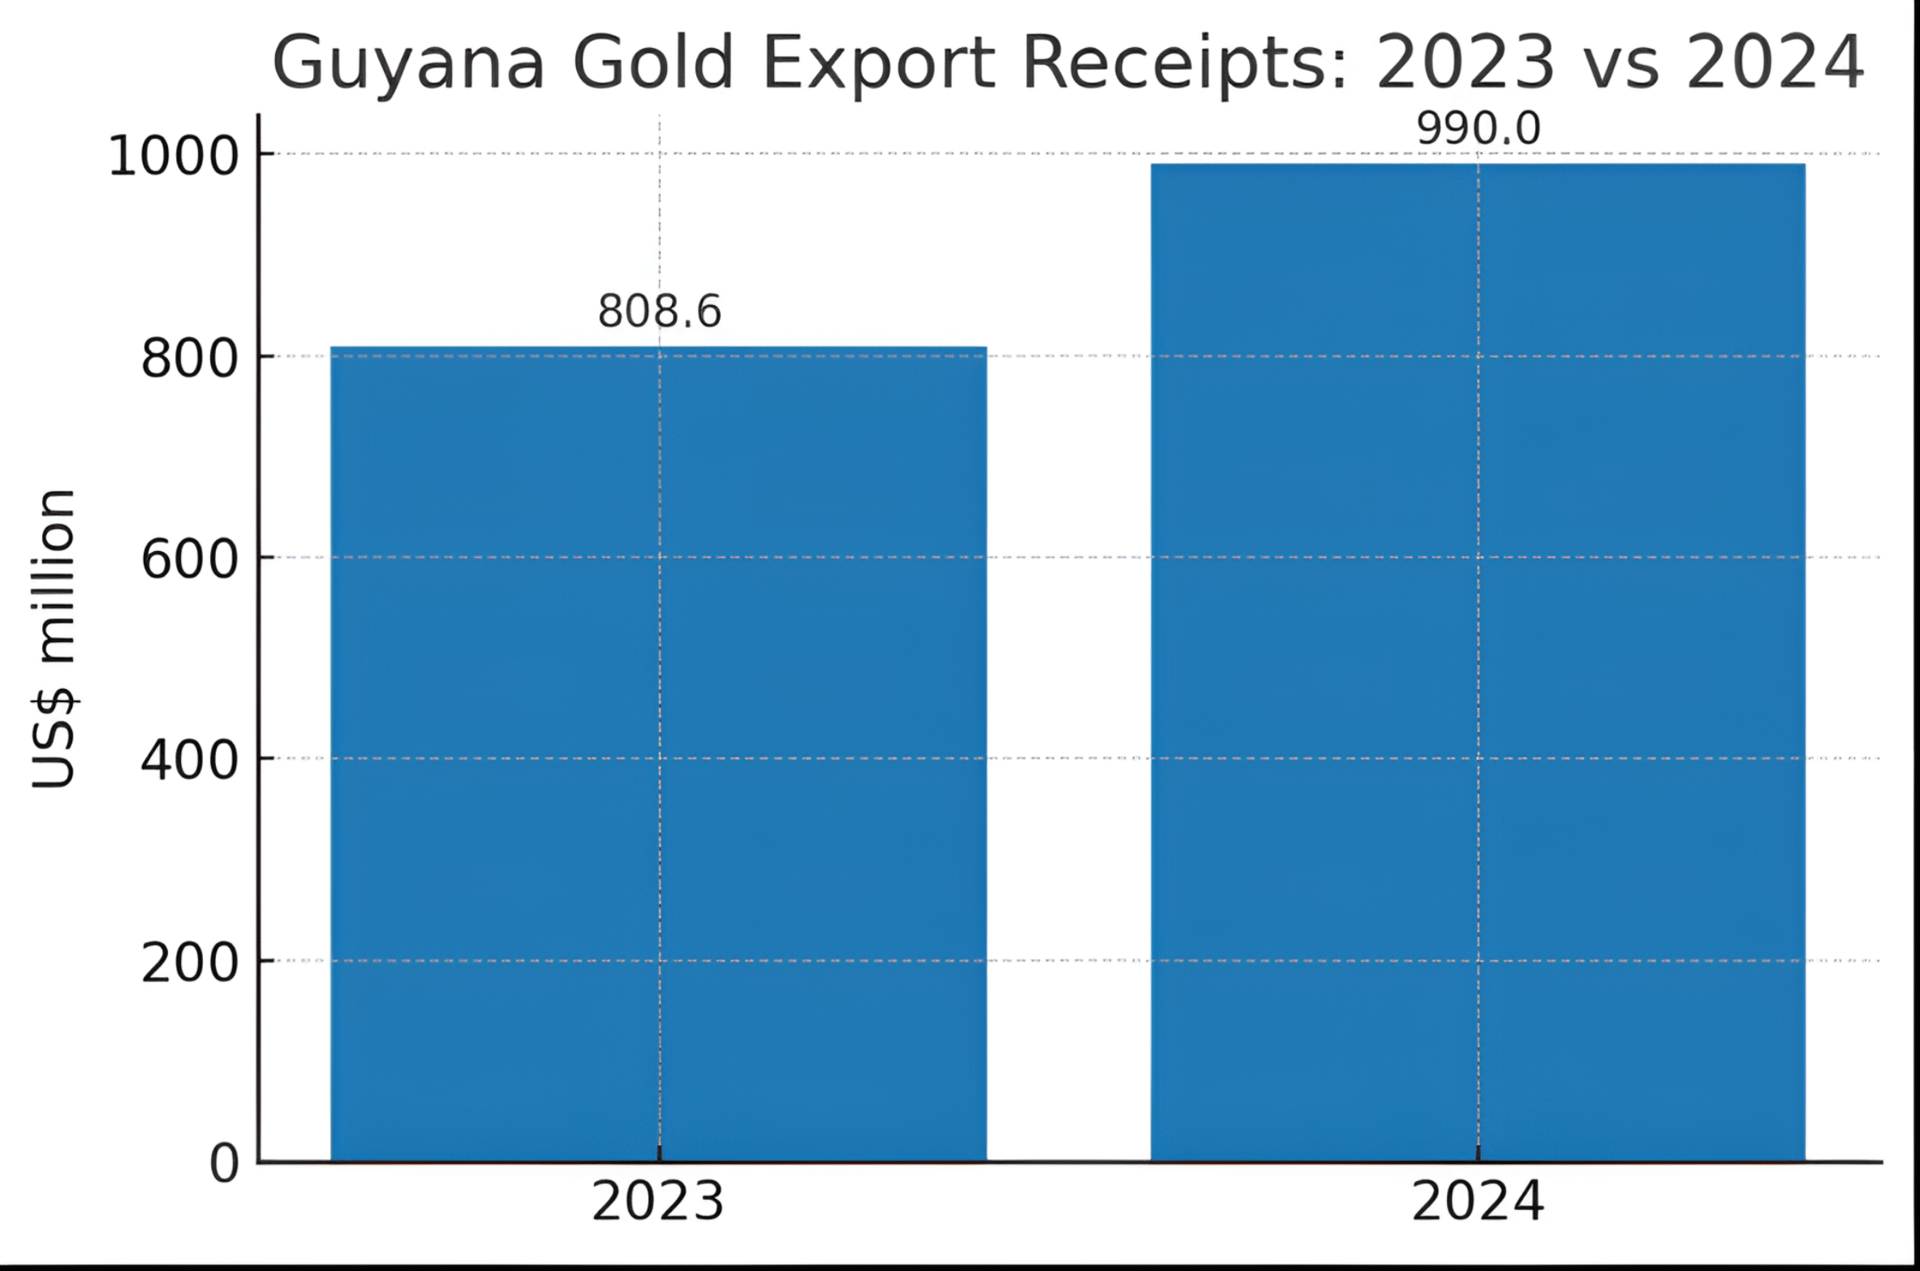
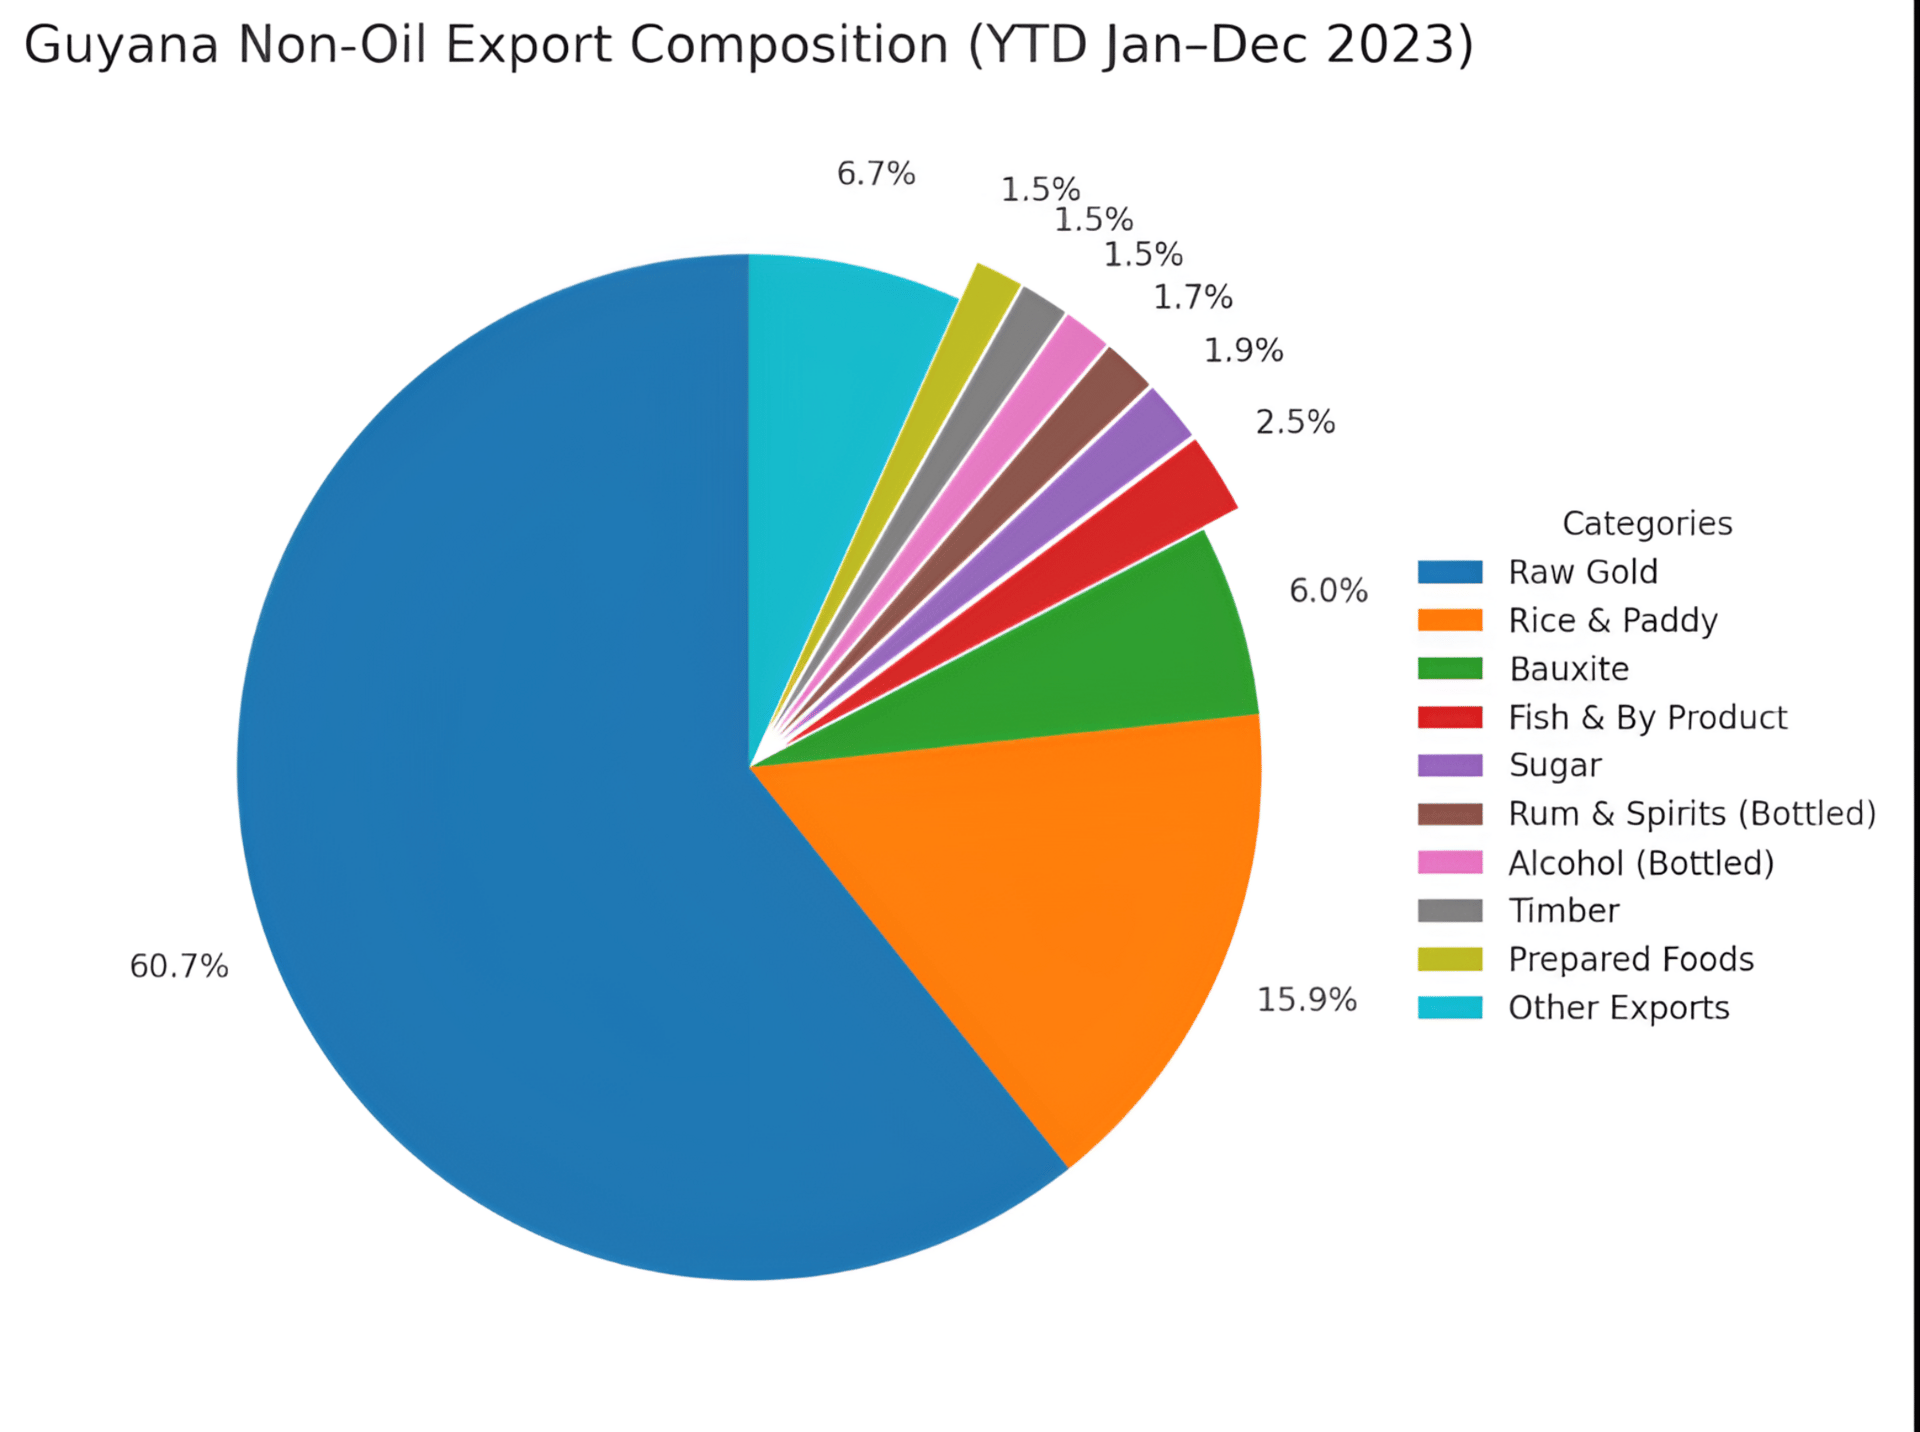
Why does this RFP matter in macro terms? Official statistics show raw-gold exports of USD 808.639 million (2023) and USD 989.996 million (2024);2-3 Bank of Guyana receipts corroborate the trend.4 Concentration risk magnifies the value of reliable geoscience: mapping improves target definition, compresses the path from reconnaissance to feasibility, and clarifies concession valuation—lowering the frontier risk premium investors embed in hurdle rates. United States Geological Survey (USGS) commodity profiles underline the strategic role of gold, bauxite and diamonds in the country’s mix,13 and the IMF’s 2023 Article IV frames the macro setting investors price into models.14
Non-Oil Export Composition, 2023
What the Mapping Program Changes
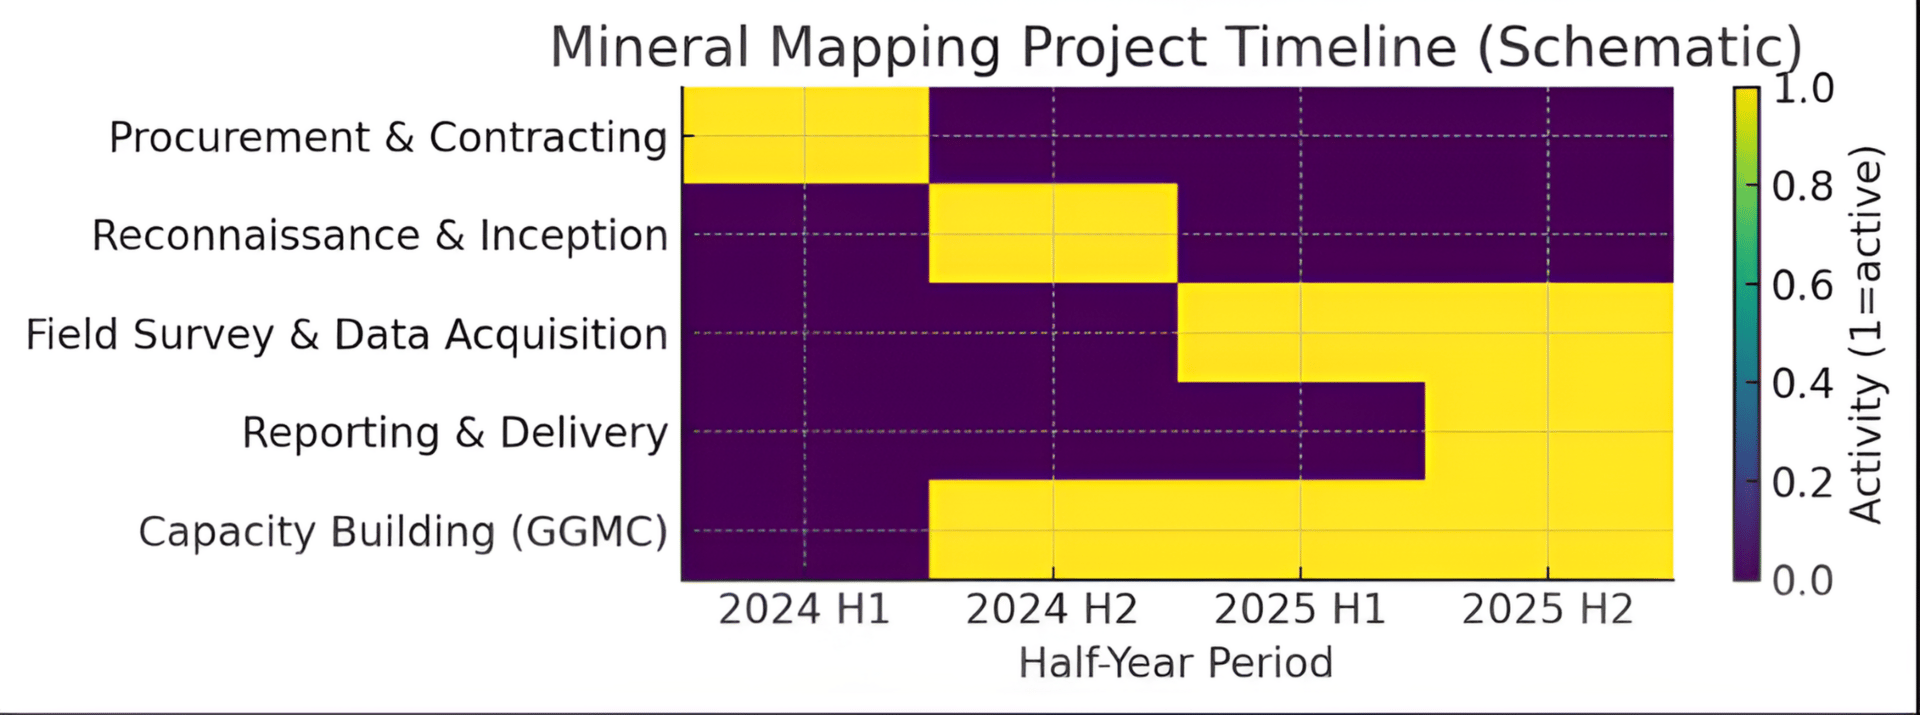
The mapping program sequences procurement and inception in 2024, field acquisition through 2025, and on‑the‑job handover to GGMC—resulting, by design, in an institution‑building exercise rather than a one‑off report.1 Outputs are structured to support licensing, oversight, and credit decisions—not just exploration.
There is a parallel environmental dividend. MRVS shows that in 2021 national deforestation was 7,630 ha, of which ≈89% was attributable to alluvial mining and mining infrastructure; earlier MRVS cycles reported similarly high shares.4-5 Mapping narrows the “search area,” reducing speculative access tracks and enabling spatial compliance checks during operations.
Deforestation Attributed to Mining, 2021
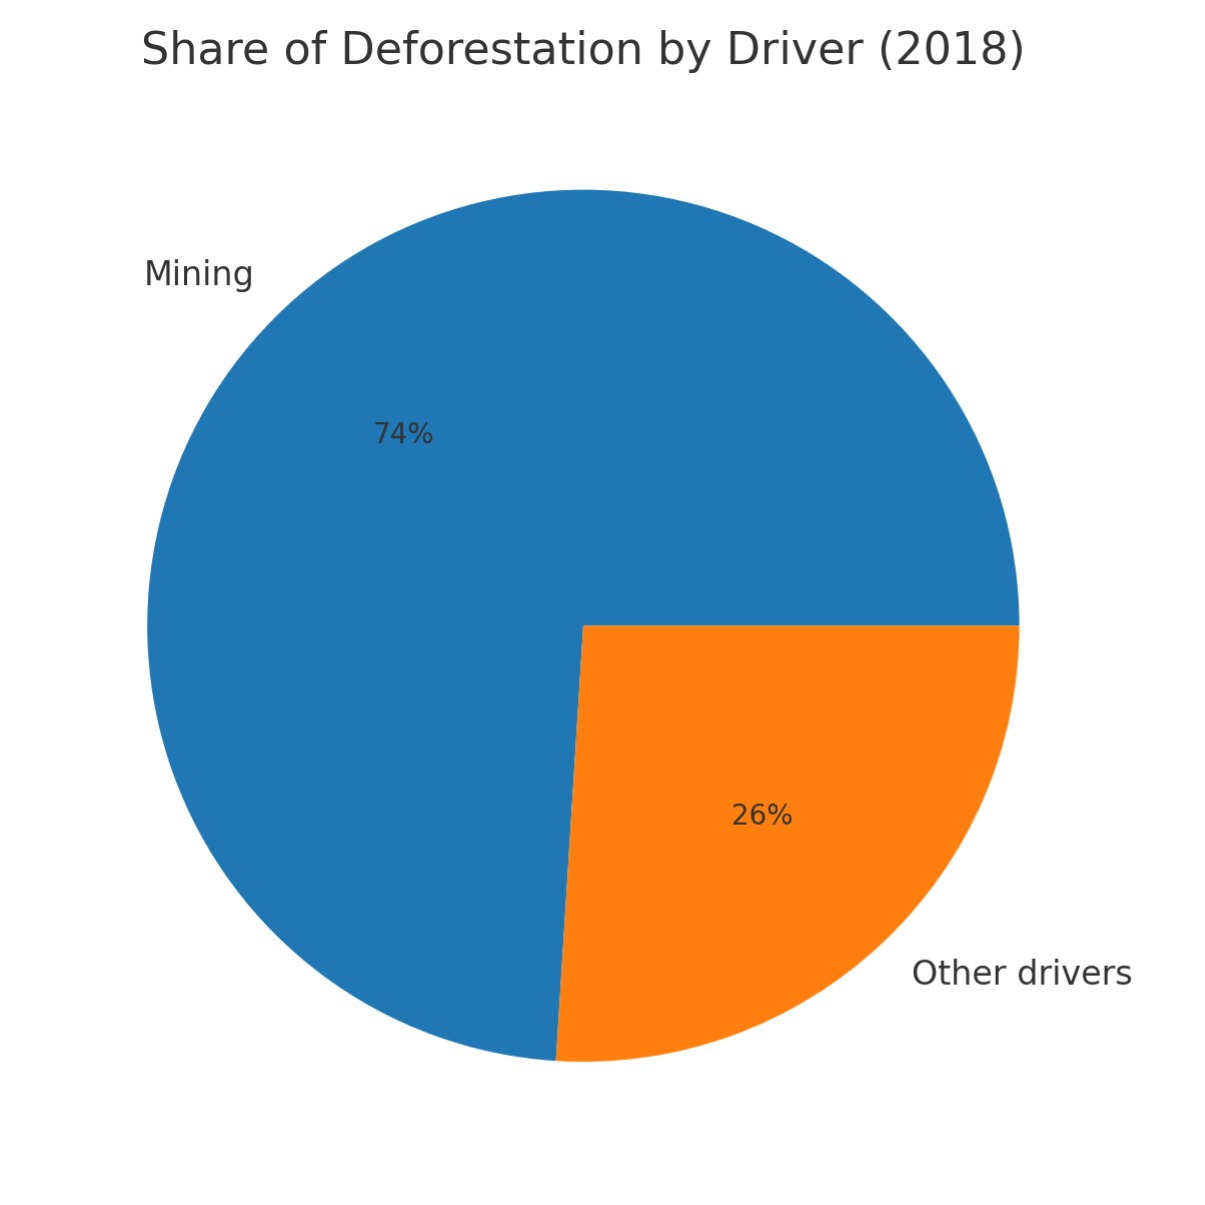
Share of Deforestation by Driver, prior MRVS, cycle (bar for historical context)
The Bridge From Data to Transparent Allocation
The Mining Act (1989) and Environmental Protection Act (1996) provide the legal spine; GGMC regulates, and Guyana participates in EITI, which reconciles payments and improves
transparency.6-8 The missing link in many frontiers is the bridge from public geoscience to rules‑based allocation.
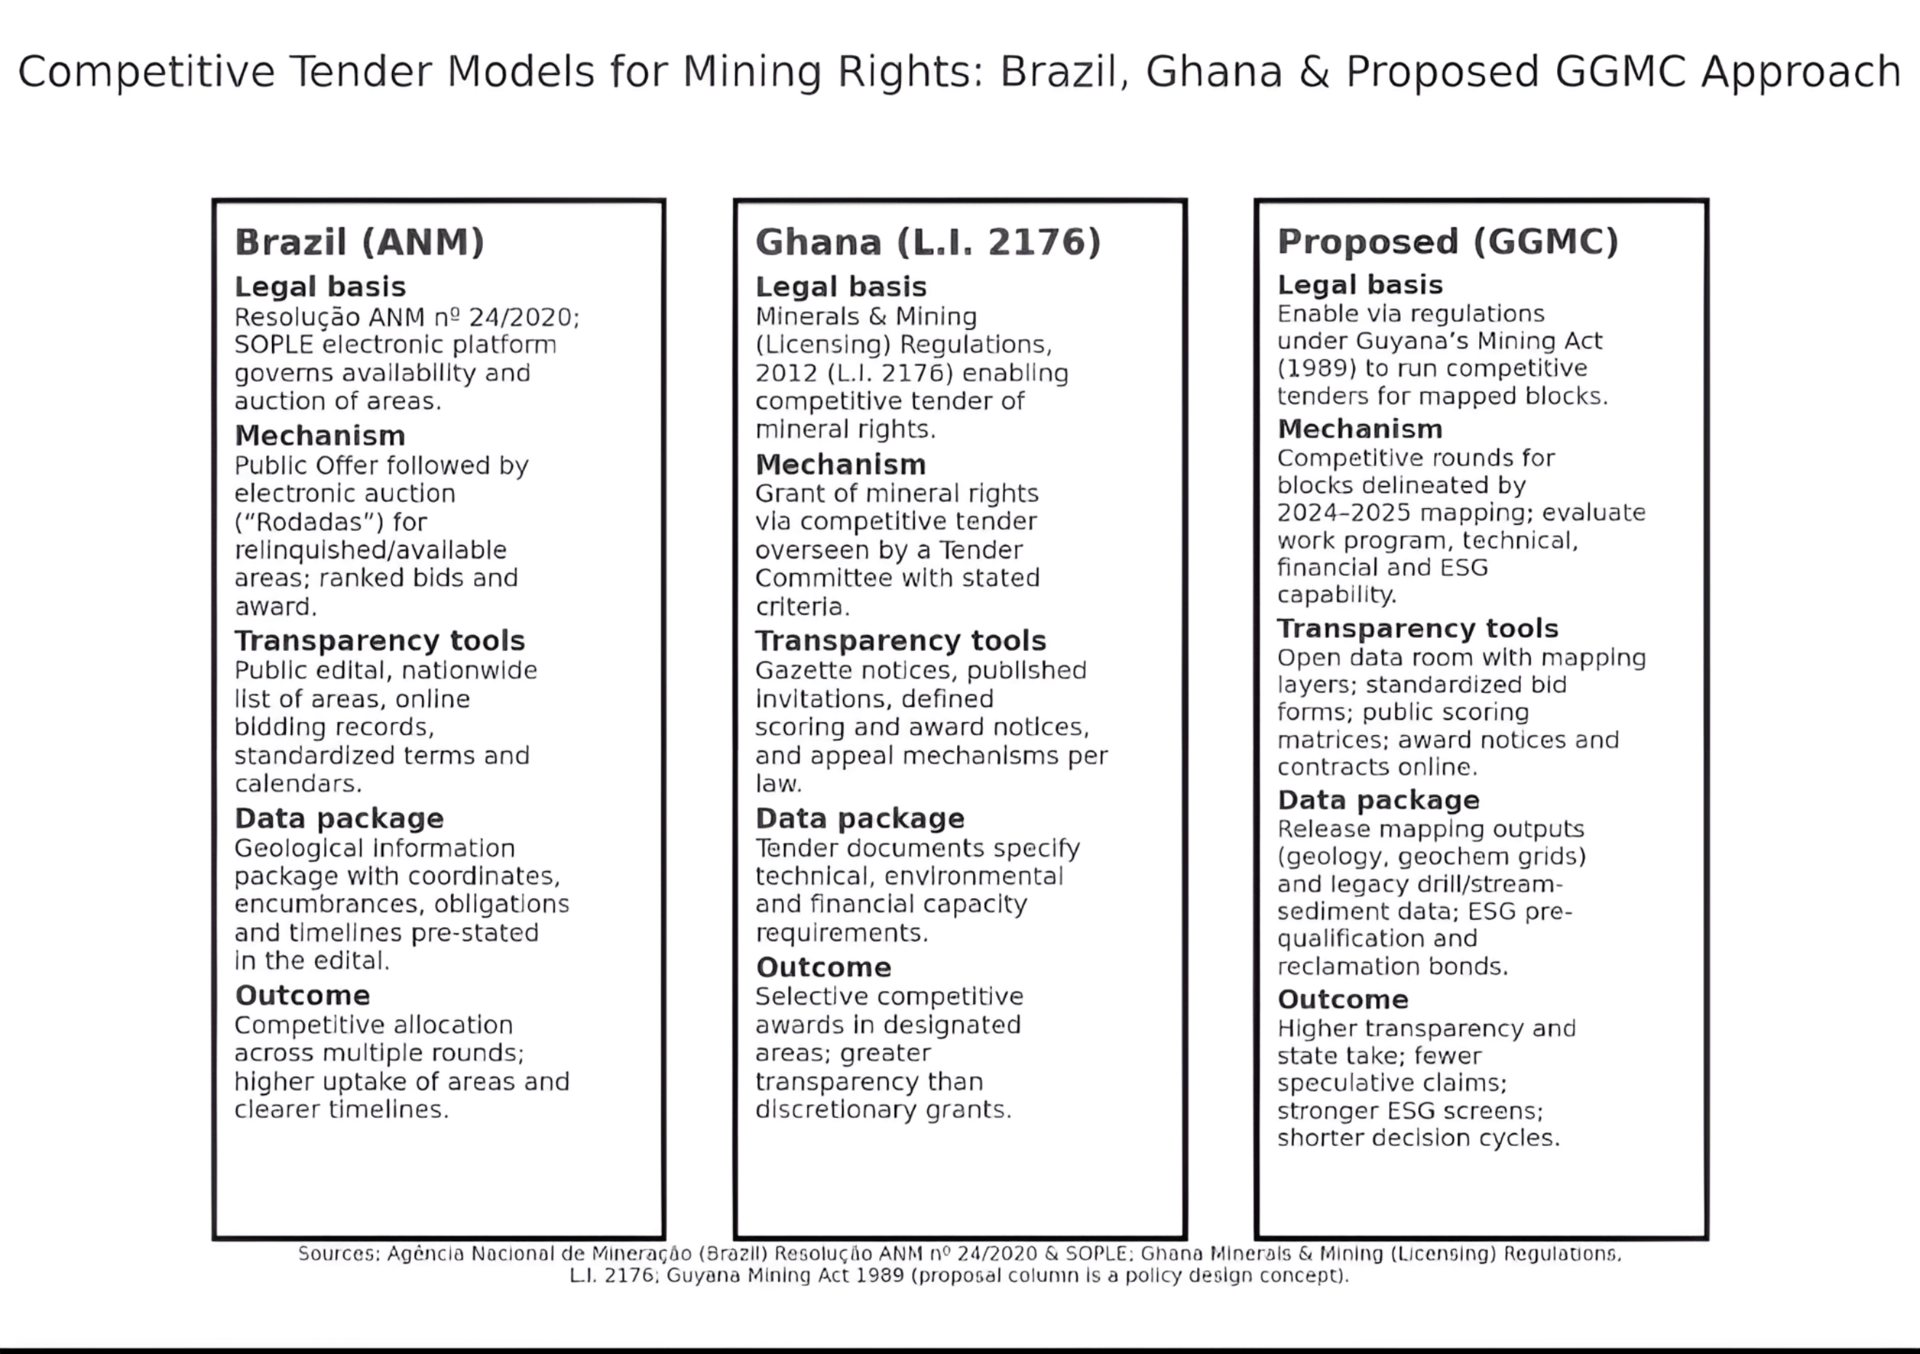
Comparable jurisdictions have solved this. Brazil’s ANM uses the Sistema de Oferta Pública e Leilão de Áreas (SOPLE) platform and process (Resolução ANM nº 24/2020) to publish areas, stage public offers, and—when multiple parties bid—run electronic auctions against standardized calendars and data packs. 9 L.I. 2176, a key legislative instrument, empowers competitive tendering under a defined tender committee process. With the mapping base in hand, Guyana can adapt both: publish a tender calendar, run open data rooms, pre‑qualify on technical/financial/ESG capacity, evaluate work‑program commitments alongside fiscal terms, require reclamation bonds, and publish awards and contracts in line with EITI practice.8-9
Competitive Tender Models For Mining Rights: Brazil, Ghana & Proposed GGMC Approach
Implications for Investors
Mapped geology plus rules‑based allocation shrink unknowns that inflate discount rates. Standardized data rooms, clear scoring, and MRVS‑linked operating envelopes shorten credit‑committee cycles and support stronger NAV multiples for credible projects1,4,8-10 Even before any new allocation mechanism is launched, improved data enables option‑style exposure (earn‑ins, ROFRs, royalties/streams, services) while paying only when policy or geology are favorable.
Implications for Policymakers and Operators
For policymakers, this architecture raises state take predictably, reduces discretionary clearing, and improves trust via EITI‑aligned disclosures.4,8- 10For operators, it delivers smaller scouting footprints, fewer permitting collisions, and more predictable logistics/power sequencing relative to mapped belts—factors that lenders and equity committees actively price.
Risks—and Why They’re Financeable
Risks remain: permitting capacity, commodity cycles, hinterland logistics and energy costs, and historic leakage/smuggling. The point of mapping is to replace corrosive uncertainty with bounded, priceable risk. With geology de‑risked and operating envelopes observable, the residual risks are the kind of capital that is built to finance.1,4,6-8
Guyana’s mapping drive is institution‑building that connects geology to governance. Whether allocation reforms roll out in pilots or at scale, the direction is toward less uncertainty, better diligence, and lower financing friction—the contours of an investment‑grade transformation that can outlast cycles.1,6,8-10
1 Ministry of Natural Resources (Guyana). (2024, April 2). Invitation for RFP: Mineral Mapping Study of Guyana’s Mineral Resources (Gold & Non‑Traditional Minerals) (Ref. MNR/GGMC/2024‑1).
2 Georgetown, Guyana: MNR/GGMC.Bureau of Statistics (Guyana). (2024). Exports by item including re‑exports, Guyana: Jan–Dec 2023. Georgetown, Guyana: Bureau of Statistics.
3 Bureau of Statistics (Guyana). (2025). Exports by item including re‑exports, Guyana: Jan–Dec 2024. Georgetown, Guyana: Bureau of Statistics.
4 Bank of Guyana. (2024). Annual Report 2023. Georgetown, Guyana: Bank of Guyana.
5 Guyana Forestry Commission. (2022). Monitoring, Reporting and Verification System (MRVS): Year 2021 Summary Report. Georgetown, Guyana: GFC.
6 Guyana Forestry Commission. (2018). MRVS Summary Report—Year 7 (2017). Georgetown, Guyana: GFC
7 Government of Guyana. (1989). Mining Act, Cap. 65:01. Georgetown, Guyana.
8 Government of Guyana. (1996). Environmental Protection Act, Act 11 of 1996. Georgetown, Guyana.
9 Guyana Geology and Mines Commission. (n.d.). Mandate and functions. Georgetown, Guyana: GGMC.
10 Extractive Industries Transparency Initiative (GYEITI). (2024). Guyana EITI Report 2022. Georgetown, Guyana: GYEITI Secretariat.
The information provided in this article is based on the best available sources and is intended for informational purposes only. Due to the dynamic nature of business intelligence, predictions, and analysis, there are inherent risks, including potential inaccuracies, omissions, or delays. All content in this article are provided ‘as is’ and ‘as available,’ without warranties of any kind, express or implied, including but not limited to accuracy, completeness, timeliness, or fitness for a particular purpose. Predictions and analysis involve risks and uncertainties, and we do not guarantee the reliability of the information. By accessing or using this publication, you acknowledge these risks and agree that we, our affiliates, our agents, and contributors shall not be held liable for any decisions made or actions taken in reliance on the content, nor for any direct, indirect, consequential, or special damages arising therefrom, resulting from your reliance on the information provided.
