Key Takeaways:
Massive Urban Growth: Georgetown’s urban area expanded by 31.4% (25.5km) between 2019 and 2022, a physical growth rate of over 10% annually.
The “Goldilocks Zone” is Key: The most intense development occurred in a specific corridor 4-6 kilometers from the city center, which captured 37% of all new growth.
Infrastructure is a Predictor: Major government infrastructure projects, such as new highways, reliably precede private development in an area by 18-24 months, acting as a clear investment signal.
Satellite Data Reveals Market Edge: The physical expansion rate of 10.47% per year, seen from satellite data, significantly outpaces formal real estate market growth projections of 5.62%, suggesting that on-the-ground development is happening faster than official reports indicate.
Georgetown's Investment Frontier Revealed by Satellite
Georgetown expanded by 31.4% in just three years1—adding 25.5 square kilometers of new development between 2019 and 2022.1 For investors and developers, this 10.47% annual growth rate signals an unprecedented opportunity in the Caribbean's fastest-transforming capital. But the real story isn't just the speed of growth - it's the predictable patterns that create a roadmap for strategic positioning and investment.
The $80 Billion Opportunity Zone
The East Bank Demerara corridor has become ground zero for Georgetown's transformation, attracting over $80 billion GYD in infrastructure investment.2 This isn't speculative development - it's coordinated growth backed by $221.4 billion in government infrastructure spending,3 a nineteen-fold increase from the $11.8 billion allocated to roads and bridges in pre-oil 2019.4
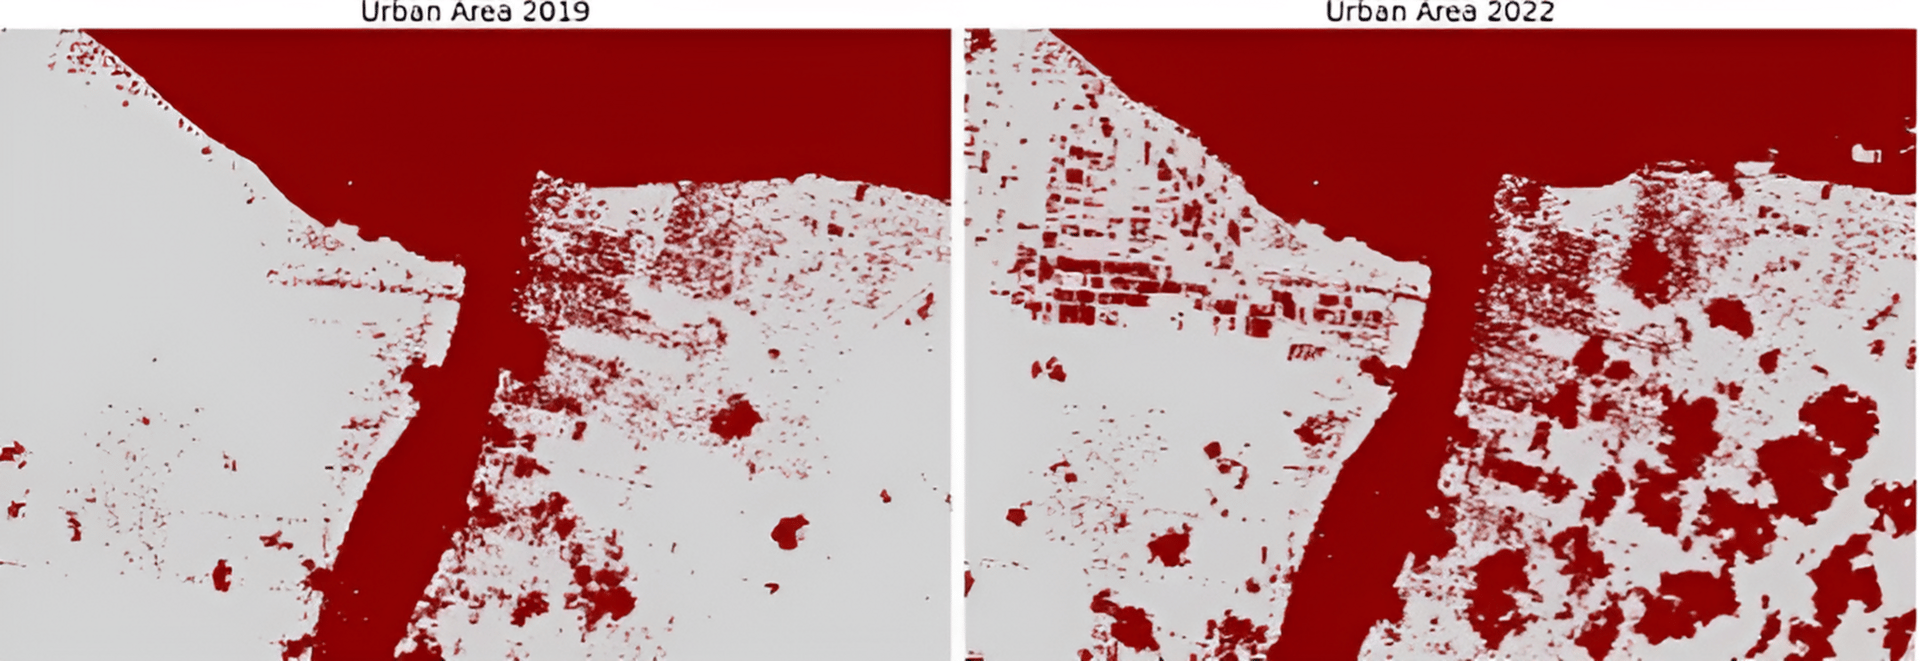
Figure 1: Georgetown Comparison 2019-2022

This satellite comparison shows Georgetown's dramatic transformation between 2019 (left) and 2022 (right). Dark areas indicate urban development, while the light areas represent vegetation and undeveloped areas. The images reveal how former undeveloped lands along the East Bank corridor have been converted to residential and commercial zones.
The satellite data reveals three critical insights for investors:
First, location is everything—but not where you think. Peak development is occurring 4-6 kilometers from the city center,1 capturing 37% of all growth with 865 development units.1 The overcrowded core saw just 129 units.1 Smart money is following the infrastructure out to the suburbs, rather than competing for scarce opportunities in downtown areas.
Second, this is an organized expansion, not urban sprawl. The government constructed the Grove-Diamond bypass before significant development began.5 The Heroes Highway preceded housing construction.5 This infrastructure-first approach creates predictable development corridors that investors can track.
Third, scarcity is already emerging. Minister of Housing and Water, Hon. Collin Croal, confirmed that "land allocations along the East Bank Demerara corridor are currently exhausted.” 6 Early movers have already secured prime positions. The question now: where’s the next East Bank?
Where Oil Money Meets Real Estate
The correlation between oil and urban growth is unmistakable. Production started December 2019,7 now pumping 630,000 barrels daily 8 — making Guyana Latin America's fifth-largest crude exporter. Our satellite analysis shows minimal growth in early 2019, then explosive expansion from mid-2020 onwards1- tracking perfectly with oil revenue flows that deposited $1.6 billion USD into government coffers in 2023 alone.9
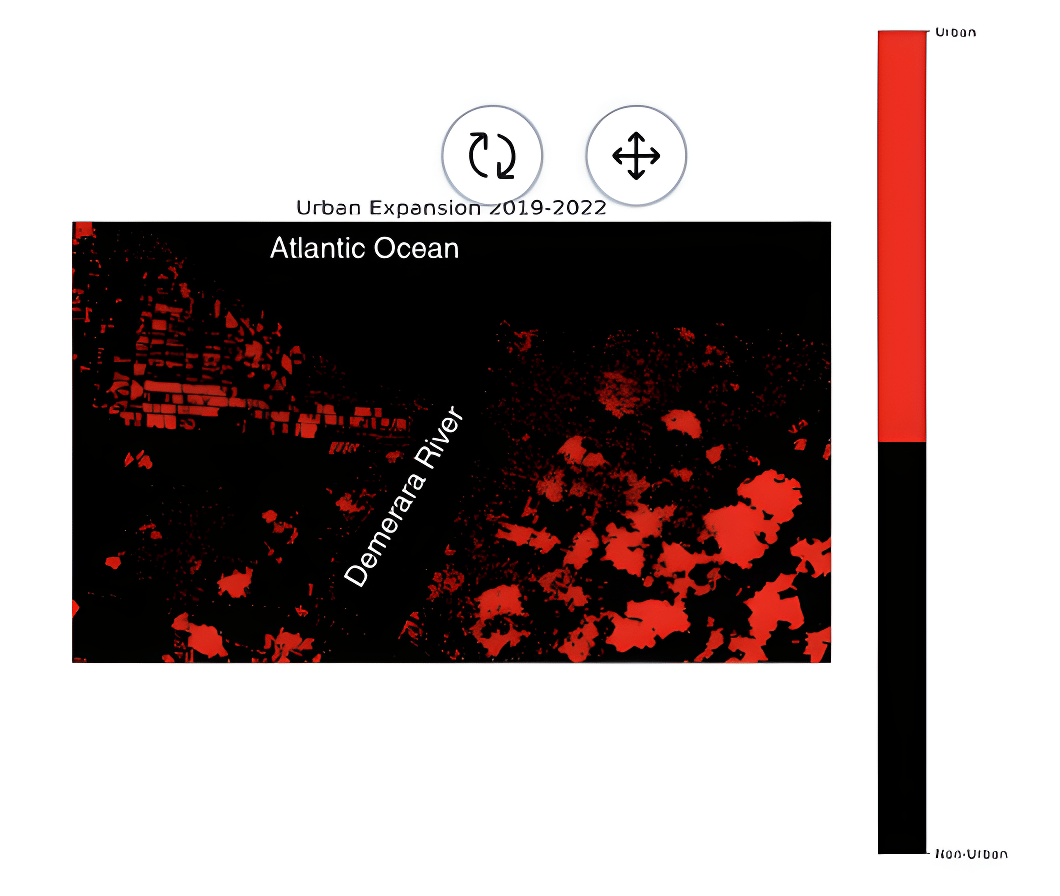
ure 2: Georgetown Expansion Map

Georgetown expansion map showing red areas of new development - The red areas on this map indicate new urban development detected between 2019-2022, totaling 25.5 km². The concentration of red along the East Bank Demerara corridor illustrates the focused nature of Georgetown's expansion.
This isn't a theoretical correlation. The influx of international oil workers, increased private sector investment in real estate, and the government's policy of making home ownership more affordable, created immediate housing demand. The government responded by allocating 30,000 house lots since 2020,10 with satellite imagery confirming that allocated lots typically show development within 18 to 24 months.1 This predictable timeline gives investors a clear window for positioning.
Diamond exemplifies the transformation. Since 2019, former sugar cane fields have been developed to house over 40,000 residents.11 The area added 1.48 km² of development,1 which is larger than the country of Monaco's entire footprint. However, Diamond's story offers a blueprint: the government allocates land, builds infrastructure, and private development follows. The pattern repeats.
Reading the Urban Growth Signals
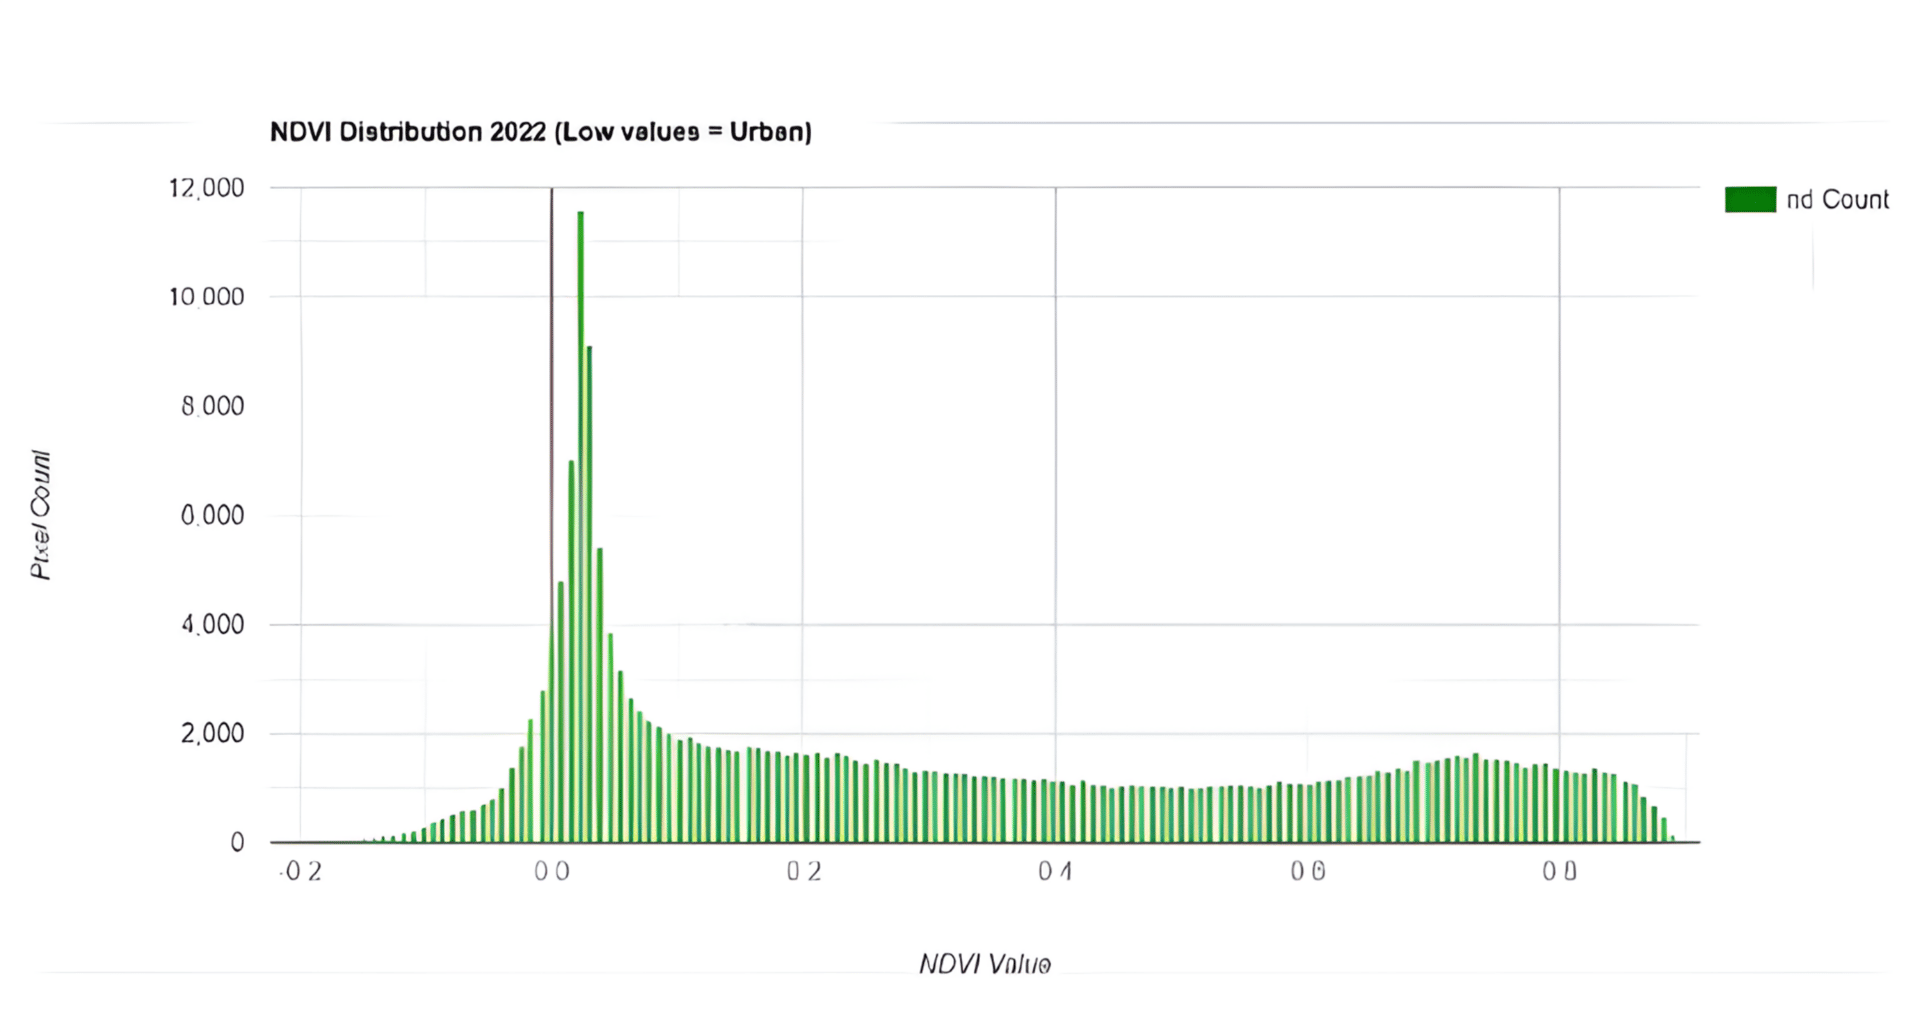
Our satellite analysis revealed a striking pattern in Georgetown's development.1 The data shows two distinct peaks—one representing dense urban areas, another showing undeveloped land, with very little in between. This sharp divide tells investors something crucial: Georgetown isn't growing gradually. It's converting vegetation to city blocks in discrete jumps.
Figure 3: NDVI Distribution Chart

The chart shows a bimodal pattern. This NDVI (vegetation index) distribution chart reveals Georgetown's binary development pattern through satellite analysis. The left peak (0 to 0.2) represents built-urban areas, while the right peak (0.6 to 0.8) shows undeveloped land. The dramatic valley between peaks indicates minimal transitional or partially developed areas—land in Georgetown is either fully developed or awaiting development, with little in-between.¹
This binary pattern indicates that development occurs rapidly once it begins. Areas are either fully urban or awaiting development, with a minimal transition zone. For investors, this creates both opportunity and urgency. When an area begins converting, the window for entry closes quickly.
The 25.5 km² converted in three years¹ equals 3,570 football fields of former vegetation transformed into neighborhoods, commercial zones, and infrastructure. At this pace, Georgetown's urban footprint reaches 110 km² by end of 2025,1 a 30% increase.
The Next Diamond: Where to Position Now
Our analysis identifies three high-probability growth zones based on the proven 4-6 km2 sweetspot and infrastructure investment patterns:
Providence (4.8 km from center): Positioned perfectly in the peak growth zone1 with major highway connections already funded. The area exhibits early-stage vegetation clearing, a pattern similar to that observed in Diamond three years ago.
Mocha/Arcadia (5.5 km from center): High vegetation coverage signals available land,1 while its position within the optimal distance band matches successful development patterns. Government land allocation announcements have already begun.
Peters Hall (6.2 km from center): Listed in the 2024 housing development budget,10 with satellite imagery showing initial clearing activity.1 Just beyond the current peak zone but following the outward growth trajectory.
The government's infrastructure investments validate these predictions. New water wells in Golden Grove the same pattern seen in Little Diamond, which now serves 10,000 residents in areas that were undeveloped in 2019. 12 Utilities are the leading indicator —where water and power go, development follows.
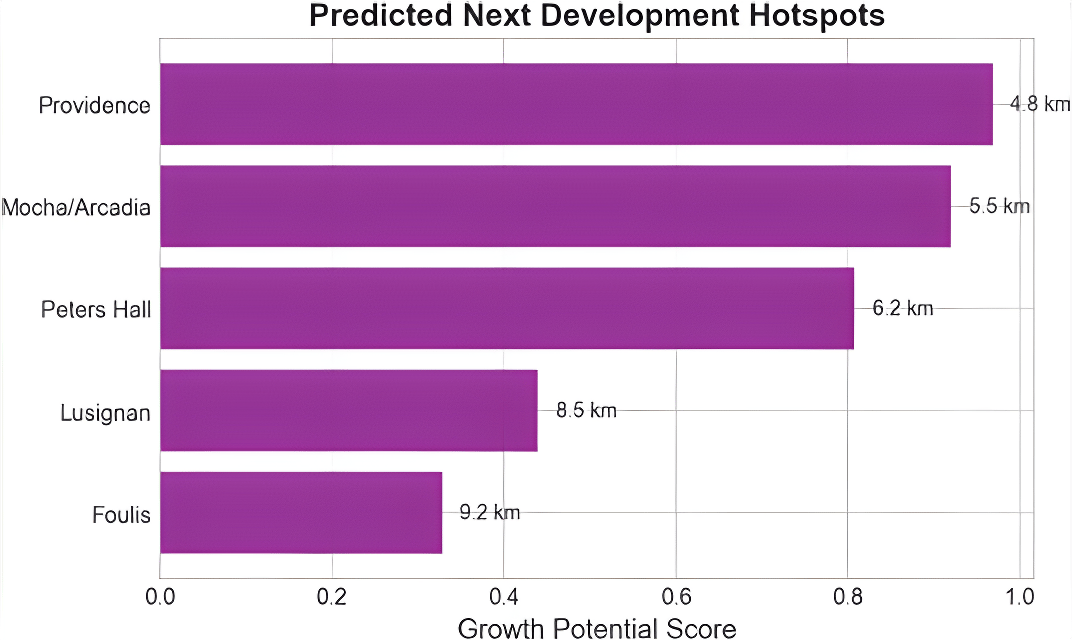
Figure 4: Growth Zones and Predictions

Figure 4: Bar chart showing growth zones and predictions - This chart displays the "Growth Potential Score" for five communities identified as likely areas for future development, with the purple bars representing the calculated score for each location. The scores highlight that Providence, Mocha/Arcadia, and Peters Hall have the highest potential for near-term growth, based on their proximity to the optimal development zones.
Infrastructure: Your 18-Month Crystal Ball
Major infrastructure projects don't just enable development - they predict it with 18-24 month accuracy¹. Current projects creating immediate opportunities:
East Coast to East Bank Road Linkage (15.5 billion GYD):12 This four-lane highway connecting Ogle to Eccles opens an entirely new development corridor. Properties along this route offer ground-floor positioning before the highway effect kicks in.
Diamond to Busby Dam Road (10.1 billion GYD):13 Connecting growth areas to the airport highway, this project extends the development zone further inland. Early investors can acquire land at pre-infrastructure prices.
East Bank Rehabilitation (19 billion GYD): Not just road repairs - this project includes utilities for 5,000 plus new plots.14 Each plot represents a future home, shop, or office.
The $1.3 trillion 2025 budget maintains this infrastructure momentum.3 Compare this to regional capitals growing at 5 to 8% with minimal infrastructure investment. Georgetown's combination of rapid growth and massive public investment is unprecedented in the Caribbean.
Market Reality vs. Market Perception
Official projections show 5.63% annual real estate growth through 2029. 15 our satellite data shows 10.47% physical expansion.1 This gap isn't an error—it's an opportunity. Physical development outpaces market pricing when transformation happens quickly. Formal valuations lag reality.
This disconnect creates arbitrage opportunities. Properties in the 4 to 6km zone offer suburban pricing with urban growth trajectories. As Minister Croal noted about East Bank exhaustion,6 scarcity drives appreciation. Today's growth zones become tomorrow's premium locations.
But investors must also understand the constraints. Satellite imagery reveals sharp urban-vegetation boundaries with minimal buffer zones.1 In a coastal city largely below sea level, drainage becomes critical. The 25.5 km² of vegetation loss affects natural water absorption.1 Innovative developers are factoring elevated construction and drainage infrastructure into their plans.
The Competitive Landscape
Georgetown's 31.4% three-year growth dwarfs regional competitors.1 Port of Spain, Kingston, and Bridgetown grow at single-digit rates. Even Panama City, long the region's boom town, can't match Georgetown's velocity. This isn't just growth—it's transformation at scale.
International hotel chains have noticed. The government announced four major hotel projects for Georgetown.2 Retail follows rooftops—every one thousand new homes need shopping, dining, and services. The multiplicative effect of residential growth creates commercial opportunities across sectors.
For local investors, the challenge is capital. For international investors, it's local knowledge. Joint ventures matching foreign capital with local expertise are emerging as the optimal structure. Knowledge and building local content requirements make partnerships essential, not optional.
Timing the Market
The satellite data reveals growth isn't linear, it's stepped.1 Areas develop rapidly once infrastructure arrives, then plateau. This creates the following distinct investment windows:
Pre-announcement (twenty-four-plus months out): Maximum upside but requires infrastructure intelligence.
Post-announcement (twelve to twenty-four months): Clear trajectory with moderate returns
Active development (zero to twelve months): Lower returns but minimal risk
Current sweet spot opportunities typically fall within the twelve- to twenty-four-month window. Infrastructure is announced but not completed. Land remains available, but won't for long. The certainty-return tradeoff favors action.
The Investment Thesis
Georgetown offers a rare convergence unlikely to repeat:
measured urban growth in the Caribbean at thirty-one point four percent1
Predictable spatial patterns: a four to six km zone captures thirty-seven percent of growth1
Infrastructure telegraph: eighteen to twenty-four month development signals1
Oil revenue guarantee: one point six billion dollars annually, funds for continued expansion9
Supply constraints emerging: Prime corridors already exhausted6
Market pricing lag: Physical growth outpaces valuations by approximately two times
The risk isn't whether Georgetown will grow—oil revenues and housing demand guarantee that. The risk is missing the positioning window while waiting for perfect certainty.
The Bottom Line
Satellite data transforms speculation into strategy. The four to six-kilometer ring around Georgetown isn't just growing, it's capturing disproportionate development while offering better economics than the crowded core. Infrastructure investments telegraph future hotspots with remarkable accuracy. Oil revenues guarantee sustained growth through at least 2030.
For investors seeking Caribbean exposure, Georgetown offers developed-market transparency with emerging-market returns. The patterns are mapped, the growth is measured, and the opportunity is finite. The next Diamond is being built now—the only question is who will capitalize on it.
1 Satellite imagery analysis using Sentinel-2 data (2019-2022). Script: https://code.earthengine.google.com/3ea45defbe6e6f1bd4da7f61e1a83238
2 More housing, commercial buzz to transform East Bank corridor, Guyana Chronicle,2024
3 https://newsroom.gy/2025/01/17/budget-2025-is-1-3-trillion/
4 New infrastructures transforming Guyana's landscape, Guyana Chronicle, 2023
5 Holistic enhancement of East Bank Demerara corridor, Guyana Chronicle,2024
6 Massive Infrastructure Works Ongoing for 5000+ Residential and Commercial Lands on EBD, Ministry of Housing & Water, 2023
7 ExxonMobil Liza Phase 1 startup, December 2019
8 https://dpi.gov.gy/homeownership-is-more-accessible-for-every-guyanese-from-2020-2025/
9 Record US$5.5bn national budget tabled in Guyana, The Caribbean Council, 2024
10 BUDGET 2024: Gov't building 1,134 more houses, News Room Guyana, 2024
11 Diamond/Grove housing scheme, Guyana Chronicle, 2010
12 Wells to be installed at new Golden Grove, EBD housing scheme, Kaieteur News, 2024
13 $10.1B https://guyanachronicle.com/2025/08/25/10-1b-great-diamond-to-buzz-bee-dam-highway-commissioned/
14 $19B investment to transform East Bank Demerara schemes, Guyana Chronicle,2023
15 Residential Real Estate - Guyana Market Forecast, Statista, 2024
The information provided in this article is based on the best available sources and is intended for informational purposes only. Due to the dynamic nature of business intelligence, predictions, and analysis, there are inherent risks, including potential inaccuracies, omissions, or delays. All content in this article are provided ‘as is’ and ‘as available,’ without warranties of any kind, express or implied, including but not limited to accuracy, completeness, timeliness, or fitness for a particular purpose. Predictions and analysis involve risks and uncertainties, and we do not guarantee the reliability of the information. By accessing or using this publication, you acknowledge these risks and agree that we, our affiliates, our agents, and contributors shall not be held liable for any decisions made or actions taken in reliance on the content, nor for any direct, indirect, consequential, or special damages arising therefrom, resulting from your reliance on the information provided.
